Updated: 02/01/2012
This web page documents some testing we have done with software and hardware pendulum period extension filters. It is based on work done by Bob McClure, who designed the software filter, and Peter Roberts' paper on "A versatile equalization circuit for increased seismometer velocity response below the natural frequency". New releases of WinQuake (Version 3.2.x and above) and WinSDR (Version 4.4.x and above) have the capability to period extend the dataset using this type of filter.
To show how this type of filter can be used to extend the period of an inexpensive 4.5 Hz Geophone senor, to make it look like a more expensive 1 Hz Geophone, we will use a local 4.5 ML event 155km from our station. Here is the USGS information for this event:
TIME LAT LONG MAG DEP LOCATION
2011/03/01 02:19:47 38.815 -122.820 M4.5 3.0km 2 km ( 1 mi) NNW of The Geysers, CABesides the 4.5 Hz horizontal Geophone sensor element, oriented East-West, we have two other sensors that have broader frequency responses that can be used to test the period extension filters. What we will look at is the local magnitude (Ml) calculated from the peak displacement value recorded by the sensor using WinQuake's Magnitude Calculator. See this Wikipedia page for more information on Ml calculation.
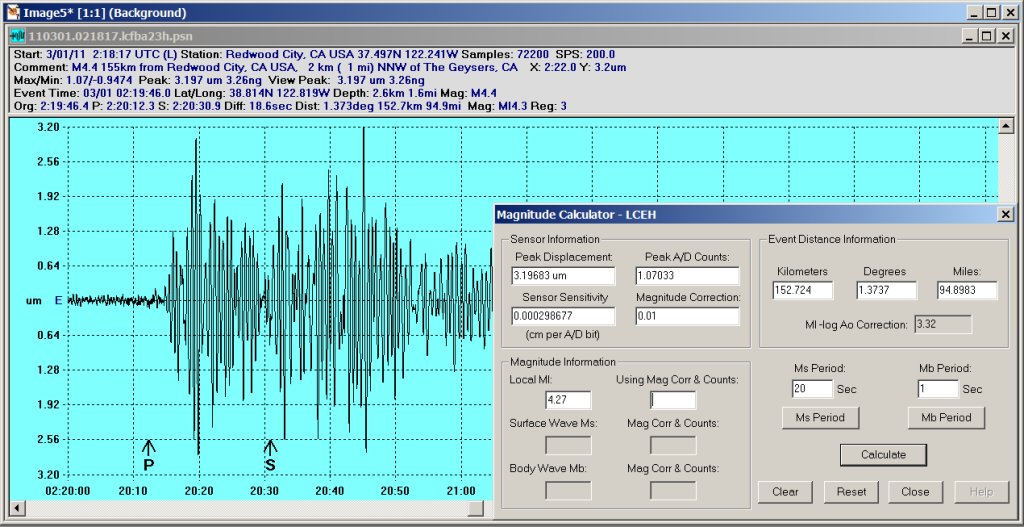
First we will look at the output of a Kinemetrics FBA-23 accelerometer as a reference. The test 4.5Hz Geophone is oriented East-West so we will only look at the E-W channel of the FBA-23. Since we need displacement to calculate local magnitude, we will need to integrate the data twice to produce displacement. The dataset is then filter using a 1.25 Hz 2-pole High-Pass filter to duplicate the response of a Wood-Anderson torsion sensor used to produce the Ml scale. As you can see the peak displacement is ~3.2 micrometers producing a magnitude of Ml 4.27.

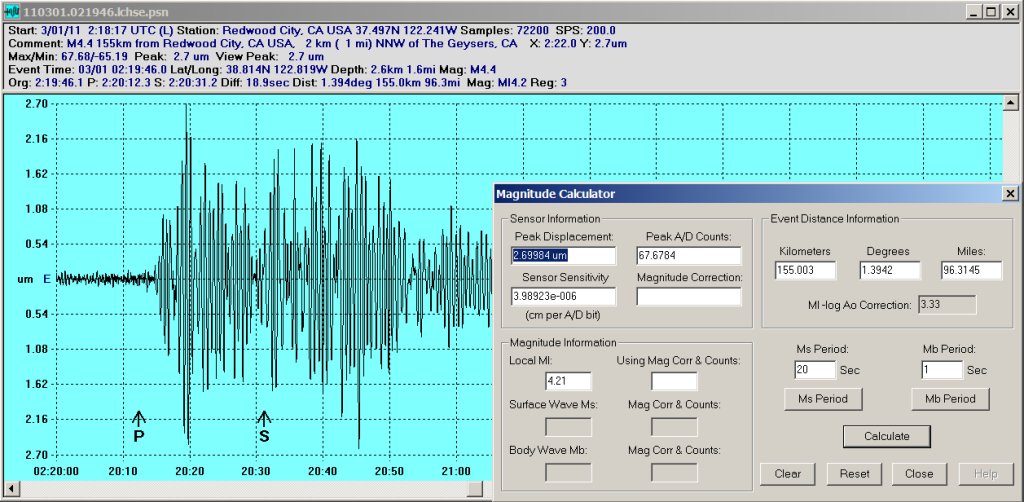
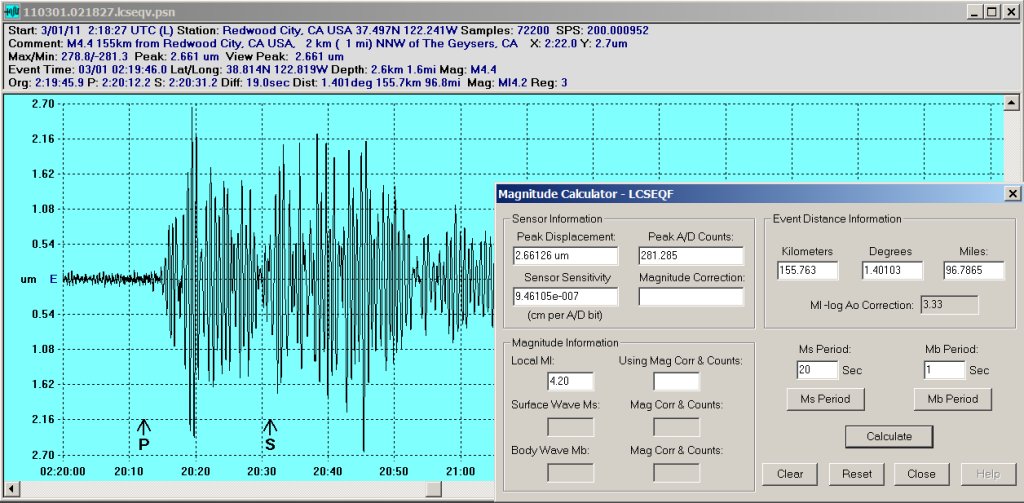
Next we will look at the output of a 1 Hz HS-1 GeoSpace horizontal Geophone. Since the output of this sensor is velocity we only need to integrated once to get to displacement. Since the output response of this sensor is near the response of a Wood-Anderson sensor a .5 Hz High-Pass filter was performed on the dataset to clean up the seismogram after integration. This yields a peak displacement of ~2.7 um and a Ml value of 4.21.
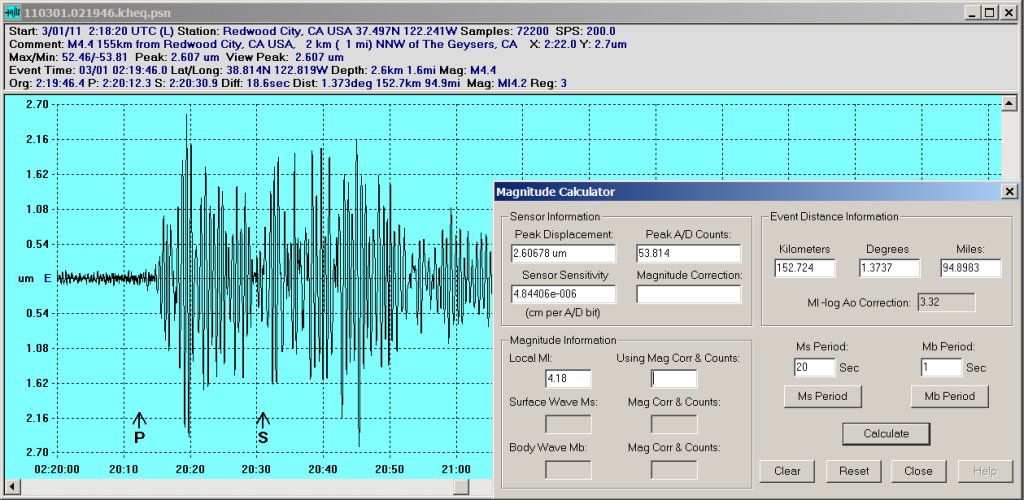
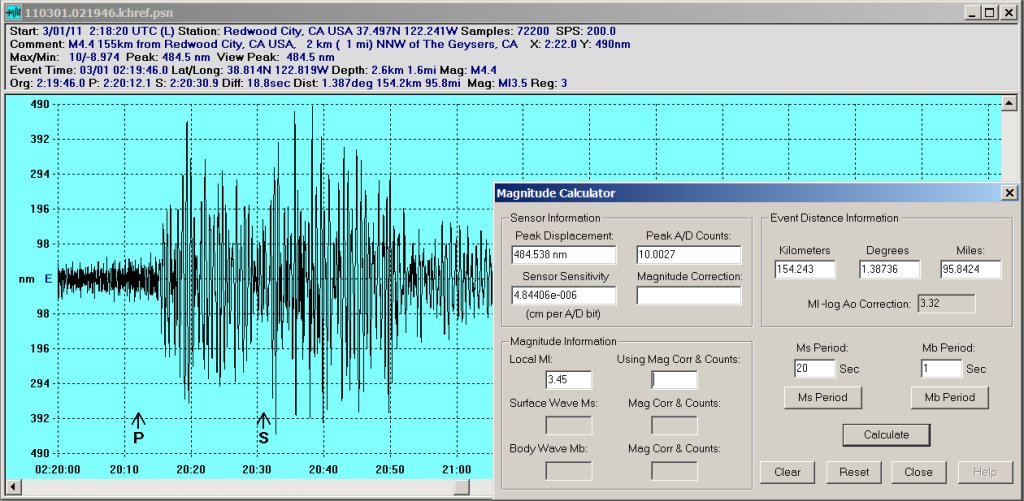
Now we will look at the output of a 4.5 Hz horizontal Geophone sensor and compare the raw data with the output of the software period extension filter. Below is the raw data from the Geophone integrated once and High-Pass filtered using a .5 Hz 2-Pole filter. As you can see the peak displacement is only .484 micrometers producing a Ml value of 3.45. Way down from the Ml 4.2 produce by the 1 Hz HS-1 and FBA-23 sensors. This is do to the 12db per octave attenuation of the predominant 1.5 Hz peak frequency produced by the event.
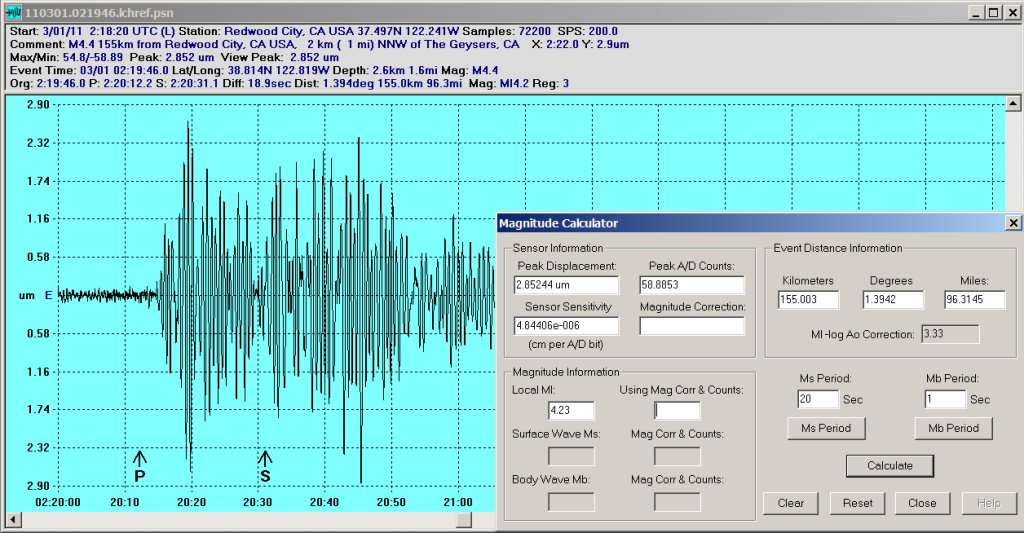
When the period extension filter is applied to the raw data the peak displacement is once again around 2.7 um producing a Ml value of 4.23. To produce the seismogram below the raw data was period extended using the following values: Pendulum Period = .222 (4.5Hz), Pendulum Q = .707 and a High-Pass filter of .5Hz. An addition 1.25 Hz High-Pass 2-pole filter was applied to the data to mimic the Wood-Anderson sensor.
The seismogram below was created using WinSDR's new period extension filtering feature. The data was post processed using WinQuake to Integrate and High-Pass filter the data. As you can see the data from a sensor can be filtered in real-time to produce an output already period extended thus eliminating the need to post process the data with WinQuake or Bob McClure's WQFilter application.
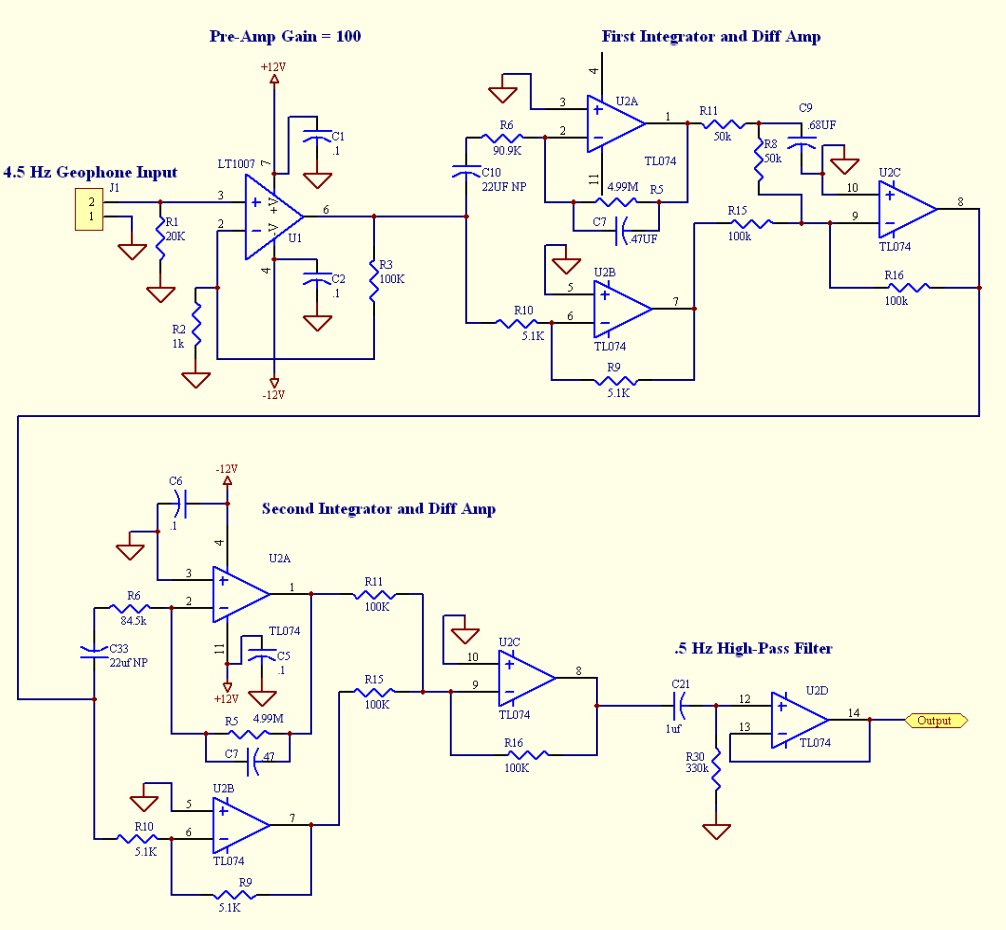
The seismogram below was created using a hardware approach to period extending the response of a pendulum. As you can see from the schematic below it takes a lot of parts to create the double integrated filter. And you still need to run the signal through a Low-Pass filter before it can be applied to the input of an A/D converter.
